SQX Launches SQXray, Daily Data on How Fast You Can Exit a Fund

If you lend against fund shares or hold them for clients, you have probably had to answer a simple question with poor data: if we had to sell this position, how long would it take, and what would it cost? The public record does not make that easy. Holdings sit in one filing, fees in another, and repurchase terms in a third. Funds file portfolio holdings on Form N-PORT within 60 days of the end of each fiscal quarter, so holdings reach the public weeks or months after the date they describe. The identifiers rarely match from one source to the next.
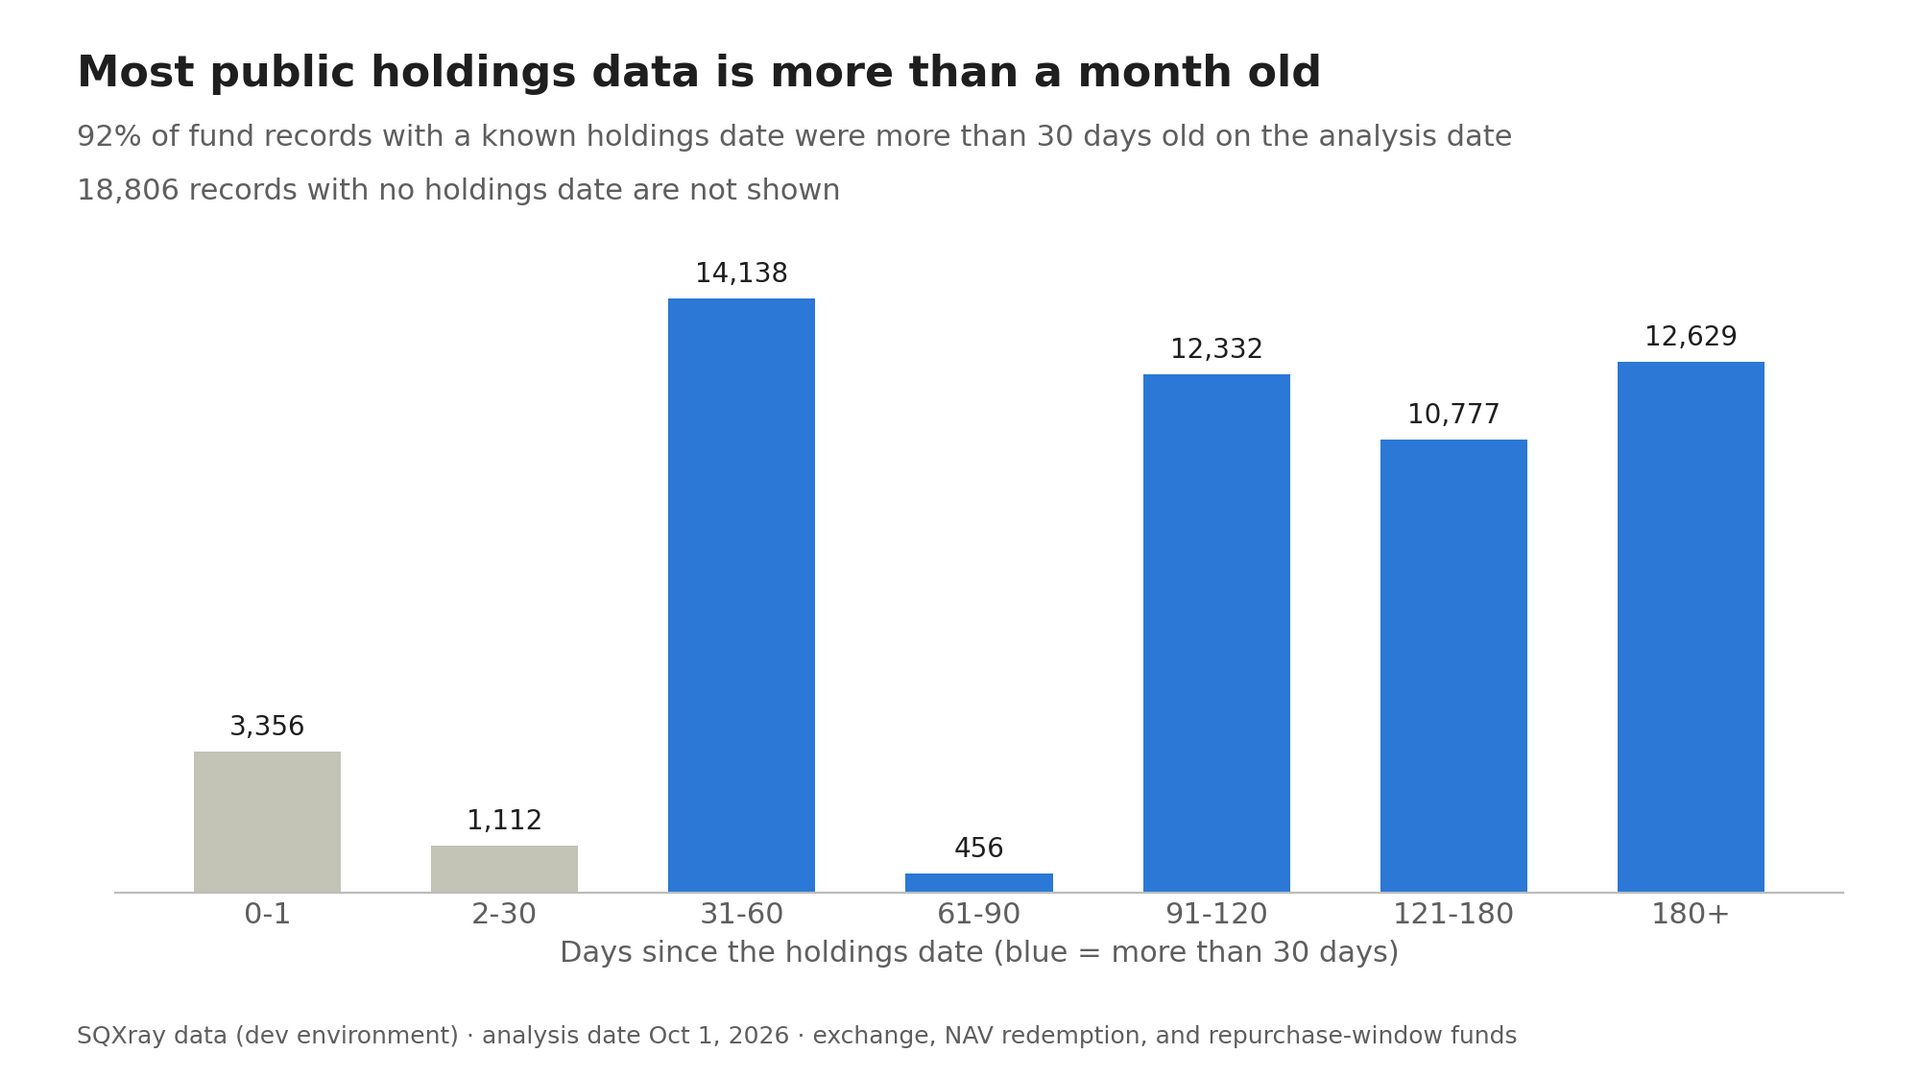
The clusters sit roughly where quarterly filing timing puts them. A fund's newest public holdings list often describes a quarter that ended months ago.
Today SQX is launching SQXray, a daily data product for registered funds. It covers mutual funds, ETFs, closed-end funds, and interval funds in the United States, Europe, and Japan. The data includes daily holdings, liquidity and exit data, portfolio analytics, cost and fee data, performance, ratings, manager and governance data, and proxy voting records. We deliver it as files by SFTP or S3.
We measure the exit from the holder's side
Established liquidity data for funds usually starts inside the portfolio and scores each security the fund owns. We start from the other side. We measure the exit available to the person who holds the fund's shares.
For each fund, we identify the exit channel. The channel can be exchange trading, NAV redemption, a tender in a repurchase window, a sale to the sponsor, or termination of the trust. We then estimate how long an exit takes and what it costs.
For exchange-traded shares, exit time is the position size divided by daily exit capacity. Daily exit capacity is the average daily dollar volume in the fund's shares over roughly the trailing 90 days of U.S. trading. For other channels, exit time is the payment term, or the days until the next repurchase window plus settlement. Stressed exit cost is stated in basis points at six fixed sizes: $10,000, $100,000, $1 million, $10 million, $100 million, and $1 billion.
For margin and securities-lending desks
When fund shares are posted as collateral, the haircut should reflect how quickly those shares could be turned into cash. Our exit profiles give the channel, the exit time, and the stressed exit cost at each fixed size. A desk can compare a $10 million position in a thinly traded fund with the same size in a heavily traded ETF on the same terms.
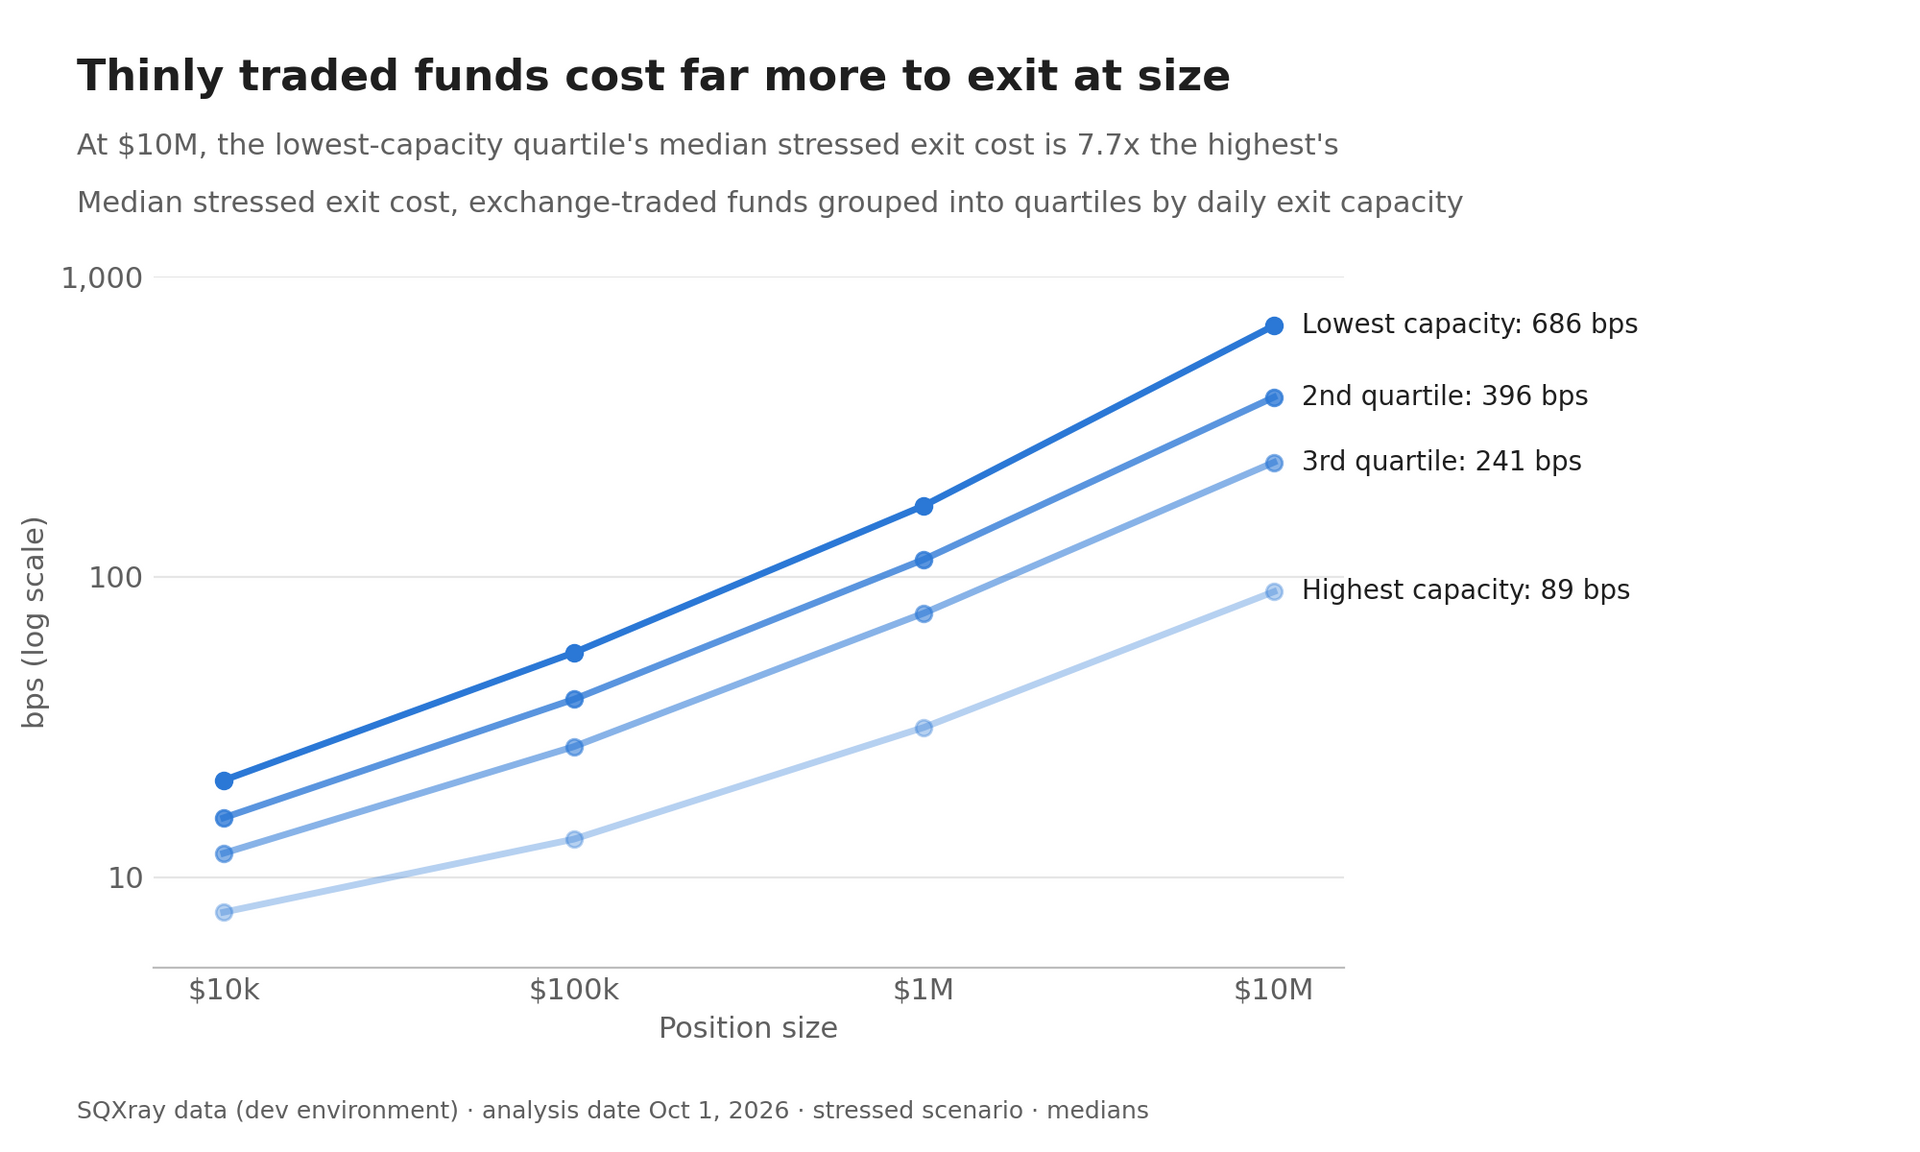
Cost per dollar exited rises with position size in every group, so a haircut set for a small position can understate the cost of liquidating a large one.
Holdings are projected to today. We take the weights from the newest filing and adjust them for price moves since that date. For the largest ETF issuers, we use the daily files those sponsors publish.
For allocators and consultants
Interval and other semi-liquid funds have grown quickly. According to the ICI 2026 Investment Company Fact Book, 148 interval funds held $131 billion in total assets at year-end 2025. The same source counts 452 interval funds, tender offer funds, and BDCs with $534 billion in total assets, up from $140 billion at year-end 2020.
These funds let investors out only at scheduled windows. Under SEC Rule 23c-3, an interval fund must offer to repurchase between 5% and 25% of its outstanding shares in each window. When requests exceed the offer, the fund repurchases pro rata, and holders wait for the next window. For each interval fund, we provide the next window date, the average capacity per window, and the number of windows a given position would need to exit in full. For funds that hold other funds, we look through multiple levels to the underlying holdings.
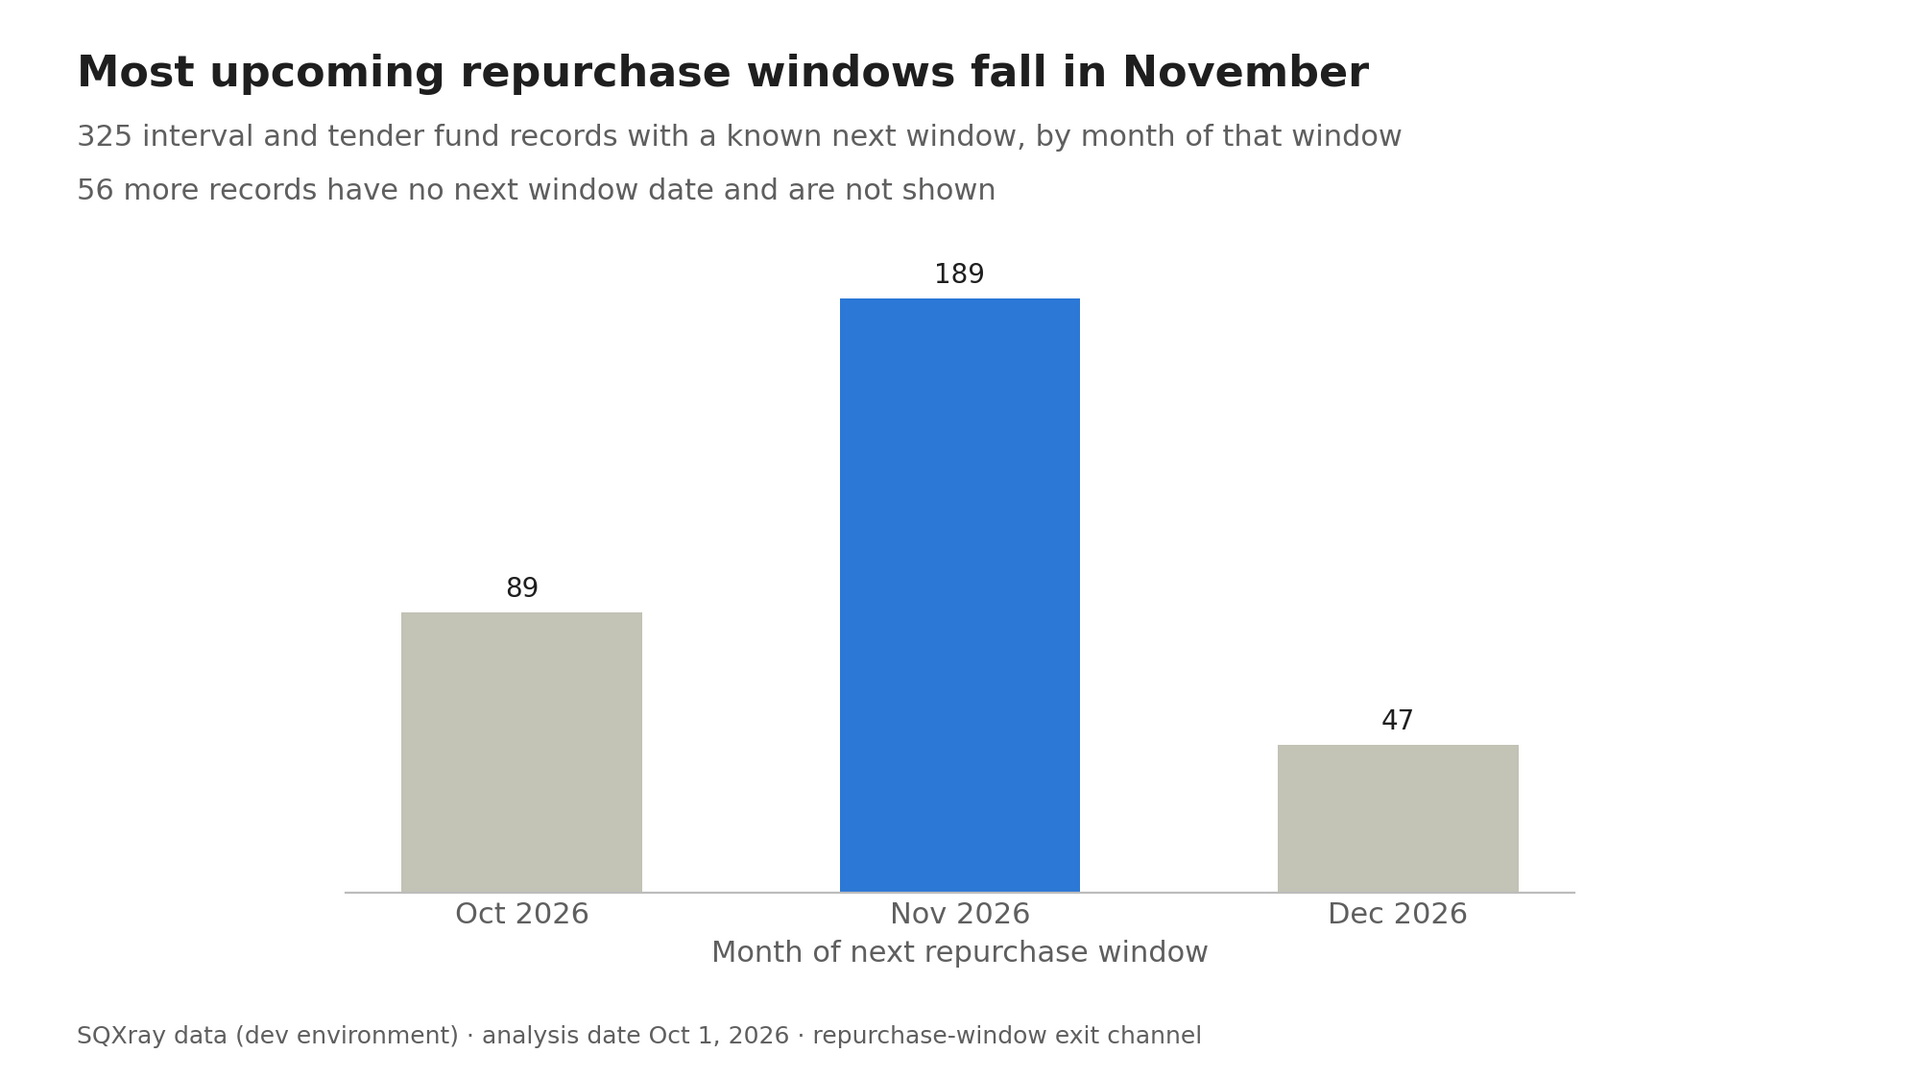
A holder who misses a window waits for the next one, so the window date matters as much as the window size.
For risk, due diligence, and fee benchmarking
Risk teams get the share count for each position and the change since the previous filing. Manager research and due diligence teams get manager and governance data, performance, proxy voting records, and a fee rank against peers. Fee benchmarking teams get cost and fee data ranked within a peer group of funds that share the same vehicle type and investment objective. The SQX Fund Rating is available for the funds we rate.
Each of these teams owns or oversees funds run by outside managers, and each needs current data that public filings deliver late, split across filing types, and under identifiers that are hard to match.
What the data is, and what it is not
Holdings update daily, but the filings behind them still lag. Projected holdings are estimates between filings. For current sources, we carry full holdings lists. For older filings, we carry the top 100 positions plus a remainder row. Exit cost uses fixed sizes from $10,000 to $1 billion. We license the data by fund list or for the full universe.
See your own list
Send us your list of collateral funds, and we will return exit profiles for the full list. Allocators can send a list of interval and semi-liquid funds and receive window dates, capacity per window, and windows needed for each position. Just send us your information at
inquiries@sqx.com, and we'll get the ball rolling.
To view the website in more detail, just visit
sqxray.com.
For more SQX news,
follow SQX
on LinkedIn and subscribe to our
LinkedIn
newsletter to stay ahead of the curve.
Latest News